
Proof of Self
Satisfaction Index
Explanation of Graph
I did a survey that indirectly measured the level of anticipation with which individuals look forward to the coming years and decades. The question that was posed to them was – “If you had to draw life on a graph, from birth to death, and show where you believe life was at its peak, most satisfying, and where it was at its lowest in satisfaction, how would you draw it?” There was a total population of 288 people interviewed for this study, with an age range of 23 to 86. It is included here as one of the proofs, because I believe that with the full development of the Self comes real power, satisfaction and happiness. I believe this stage of life should be eagerly anticipated and looked forward to. Not be as it is today – a happy to be alive – and a physically weakening time of life. These explanations on the graph will help me to explain my findings.
Study Findings
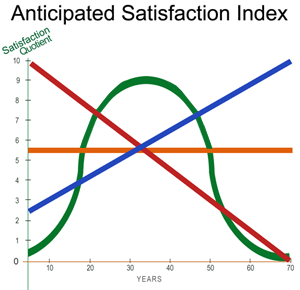
The horizontal set of numbers indicates decades in a human life span. The vertical set of numbers indicates the level of perceived or anticipated satisfaction.
Green – Bell Shaped line – 73% of the participants interviewed subscribed to this view of life and satisfaction. It starts at around 1 on the Satisfaction Index and peaks between 30-50 and then steadily declines. Their age range was from 23 to 69. These individuals felt that there comes a time, somewhere between 30 and 50, when life starts to become a downhill experience. Irrespective of their age, they were unanimous in not really looking forward to aging, and certainly not to the next decade. They felt being a child/teenager was too powerless, had few choices if any, and even the lack of responsibilities did not make it more attractive. They also felt that the whole aging process, except for things like greater material wealth or security and higher career achievements was still by and large a negative experience. They would have preferred to stay young, between 20-30.
Red – Descending Line - 12% of the participants interviewed subscribed to this view of life and satisfaction. It starts at 10 on the Satisfaction Index and goes steadily down till 70-80 years of age. This group was aged from 30 to 83. Their notion was that life could not possibly be any better then when you and your every need are taken care of. You are also loved unconditionally. The rest of life after infancy and childhood is an ever escalating series of struggles, disappointments, with ever greater responsibility, ending with a slowly eroding physical and mental capacity.
Blue – Inclined Line - 10% of those interviewed subscribed to this view of life. It starts at around 3 on the Satisfaction Index and goes steadily upward as we age. This group was aged from 65 and 86. The reasons given were that as you age you tend to accept things the way they are. You let go of your dreams and become more realistic. Eventually the kids grow up and leave, reducing responsibility, and then, ultimately you can retire and not have to work. The high point of life, not having to work is what they felt is worth looking forward to, due to the opportunity to do the things they wanted – reading, traveling, watching the grandchildren, etc.
Orange – Level Line - This group represented about 5% of the total interviewed. It starts at around 5-6 on the Satisfaction Index and stays there. They were aged between 35 and 72. Their reasoning went like this - life always has its ups and down - so it doesn’t really get any worse or better. Perhaps with age we get to handle our problems more effectively. Life is what you make it.
Conclusions
Only 10% in the study felt life was designed to get better and that aging was good because they have something to look forward to. Everyone in this group was already over 65, so we might suppose they were rationalizing their situation or perhaps this time in their life was the best that they had experienced. Even though this group was looking forward to grandparenting, reading, traveling, gardening and other things they wanted to do, I strongly feel that as pleasant as those activities are they are not synonymous with developing and growth. On the other hand, if we add up the other percentages on the graph we can see that almost 90% of all people interviewed characterized life as a process, which after 50-60 has more negative aspects associated with it than positive - a decline of body and mind, health issues, financial dependency. For these participating individuals their physical vitality and mental sharpness seemed to be more important then having FREE time. Simply doing activities that do not generate anticipation and excitement defeats the purpose and potential that life holds for us at the latter stages of our life.
None of the 4 groups had the concept, the context that the most exciting stage of development, the one that has the greatest potential for achieving true satisfaction, develop power, effectiveness, mission, passion, connection, fame, even fortune is the last stage of life – after 40-50. This last stage of development starts at approximately 40-50 years of age, and can continue till death! Within our developed Self lies the answer to the question, “What is my life’s purpose, and do I have all of the tools necessary to carry out that purpose?” Only when we come into the knowledge of our life’s purpose and find ourselves engaged in pursuing it successfully do we come close to the satisfaction we are all entitled to. I believe in order to manifest true satisfaction we must discover and achieve our life’s purpose, and we can only do this if our Self is fully developed, which at this time in our history is mostly possible for those of us in the last stage of.